Visualization functions
Some basic visualization functions based on pyDeck framework. functions and method stated below are part of GraphSims class.
GraphSims Functions
Map_Show func
Map_Show(show='base', map_style='light', height=500, width=500, viewZoom=17, viewCenter=None)-
returns pydeck.bindings.deck.Deck
pydeck.deck.Deck mapBuilds, compiles, and returns pydeck interactive map of the network. it compiles all pydeck.bindings.layer.Layer kept on GraphSims.pdkLayers. Function can be directly used, it will run GraphSims.Map_BaseLayerInit() if no layers on GraphSims.pdfLayers are detected.
Showing Map
On jupyter environment, map can be directly shown if the last line of the cell is GraphSims.Map_Show(). Or, result can be kept as variable and shown with Deck.show() or further manipulation of the pydeck object.
Parameters
-
- show : str default 'base'
- options of map shown, a shortcut for GraphSims.Map_LayerAdd. other case 'junction' to run GraphSims.AddLayer('junction') to show junctions internally.
-
- map_style : str default 'light'
- options of pydeck basemaps.
-
- height : int default 500
- pydeck display height size
-
- width : int default 100%
- pydeck display width size in percent
-
- viewZoom : int default 17
- pydeck display view zoom
-
- viewCenter : None|list default None
- pydeck view center, list/tuple of size two floats, in lon, lat coordinates in degrees
Use Example
-
on jupyter this cell will show the map
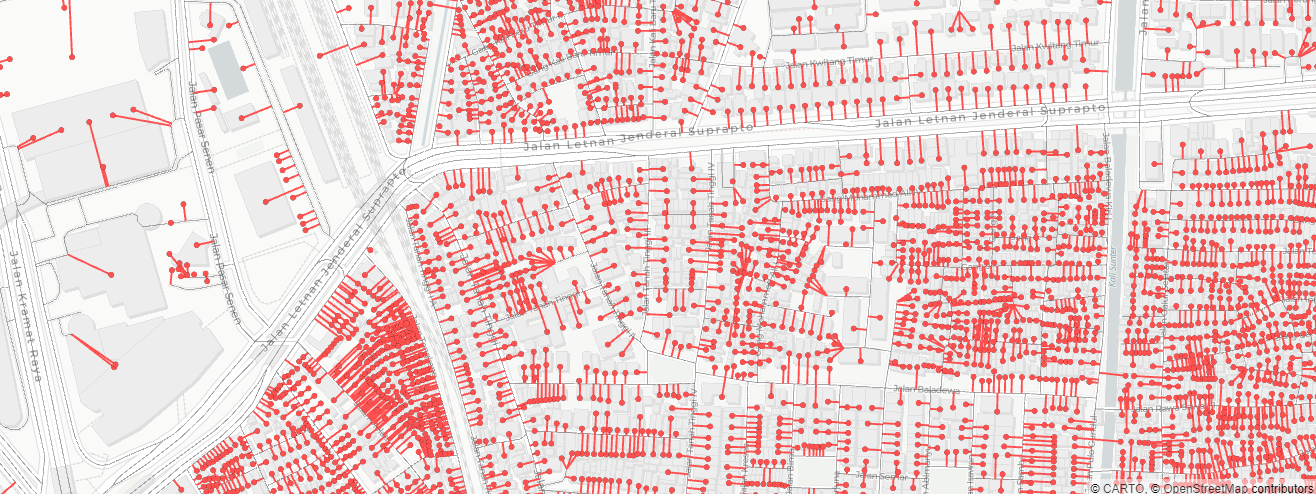
Example of default 'base' results:
Example map result for 'junction', note that dead ends are labelled red, and the shown numbers are the numbers of connected edges.nwSim = sna.GraphSims(dfNetworkSg, dfEntries, settings) # graphsim init mapDeck = nwSim.Map_Show(base='junction') mapDeck.to_html('foo.html') mapDeck.show()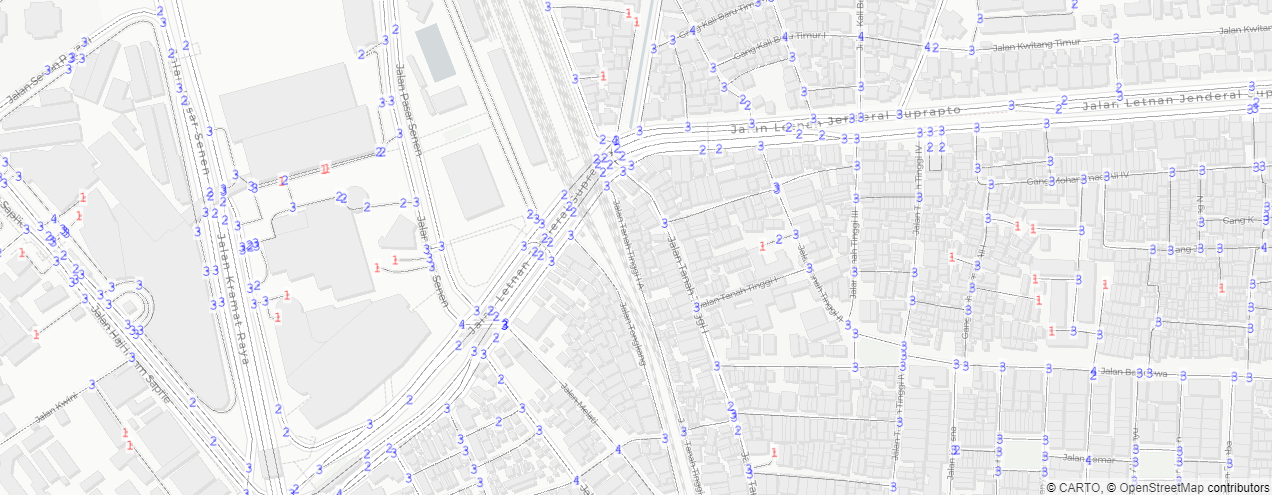
Accessing pydeck.bindings.deck.Deck for further capabilities.
-
Map_LayerAdd func
def Map_LayerAdd(self, layers:dict)-
returns void Add specified attribute and compiles to GraphSims.pdkLayers, with options for visualizations. to show map use Graphsims.Map_Show(). Will initialize Graphsime.Map_BaseLayerInit()
Same Attribute/Field name on Network and Entries dataframes
Some simulations/analysis adds attributes to both network and entries dataframe. Due to procurement of layer by using attribute name, both entries and network will be appended. to remove one of them, use pop.(the index of the layer) in Graphsims.pdkLayers and Graphsims.pdkLyrNm
Parameters
-
- layers : dict required
-
- Dictionary of key items are layers, and values of settings. For default view settings use None as value. (i.e. {'Btwn':None})
- the value are also in dictionary format, with settings available:
- 'label' : bool default: True- to turn on/of labels of values 'labelsize': int default: 9- size of label in points
- 'colors': list/str default: 'viridis'color ramp in 2d list of rgb, or string 'viridis' or 'spectral' for feature symbology
- 'vmin': None/float default: None- lower bound value for symbology distribution
- 'vmax': None/float default: None- upper bound value for symbology distribution
- 'distribution': str default: 'decile'- distribution by 'linear', 'quantile', or 'decile'
- 'Omin': float default: 1.0- lower bound value for symbology size (for lines and points)
- 'Omax': float default: 5.0- upper bound value for symbology size (for lines and points)
Use Example
-
Related items/values in GraphSims to Mapping
-
.pdkLayers list
-
list of pydeck Layer
Compiled layers for pydeck visualization.
-
-
.pdkLyrNm list
-
list of pydeck Layer names
For NetworkDf based layers have '_Ntw' suffix, with label layers have '_NtwLbl' suffix For EntriesDf based layers have '_Ent' suffix, with label layers have '_EntLbl' suffix
-
-
.pdkCenter Shapely.Point in degrees (epsg:4326)
- Center point for initial view center, on GraphSims.Map_BaseLayerInit(), coordinates will center on network df center using geopandas GeoDataFrame.geometry.unary_union.centroid.
@September2024